Works

U.Farm
About
UFARM
Nature at Your Doorstep
It was Covid times, the times called New Normal as a virus shook the whole world and pushed the humanity to rethink about their behaviors, lives, cities. By this influence, I designed UFarm, which is a combination of digital and physical experience projected in 2030, for people genuinely interested in farming and in eating healthy in cities.
THE SNAPSHOT
The Challenge:
Urbanization and post-COVID lifestyles have weakened people’s connection to fresh food. As cities will host 70% of the population by 2050, future urban landscapes must prioritize wellbeing, clean air, and local food production.
The Solution:
UFarm reimagines urban agriculture for 2030 through a hybrid ecosystem of modular farming units and a community platform, empowering Gen Z and Millennials to shift from consumers to urban food producers.
Key Deliverables:
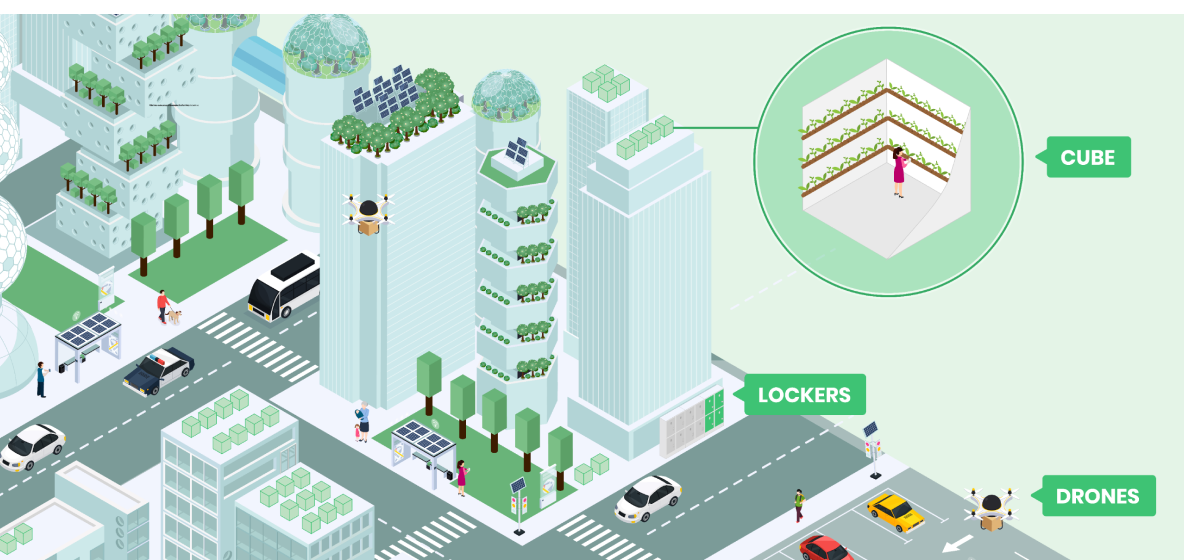
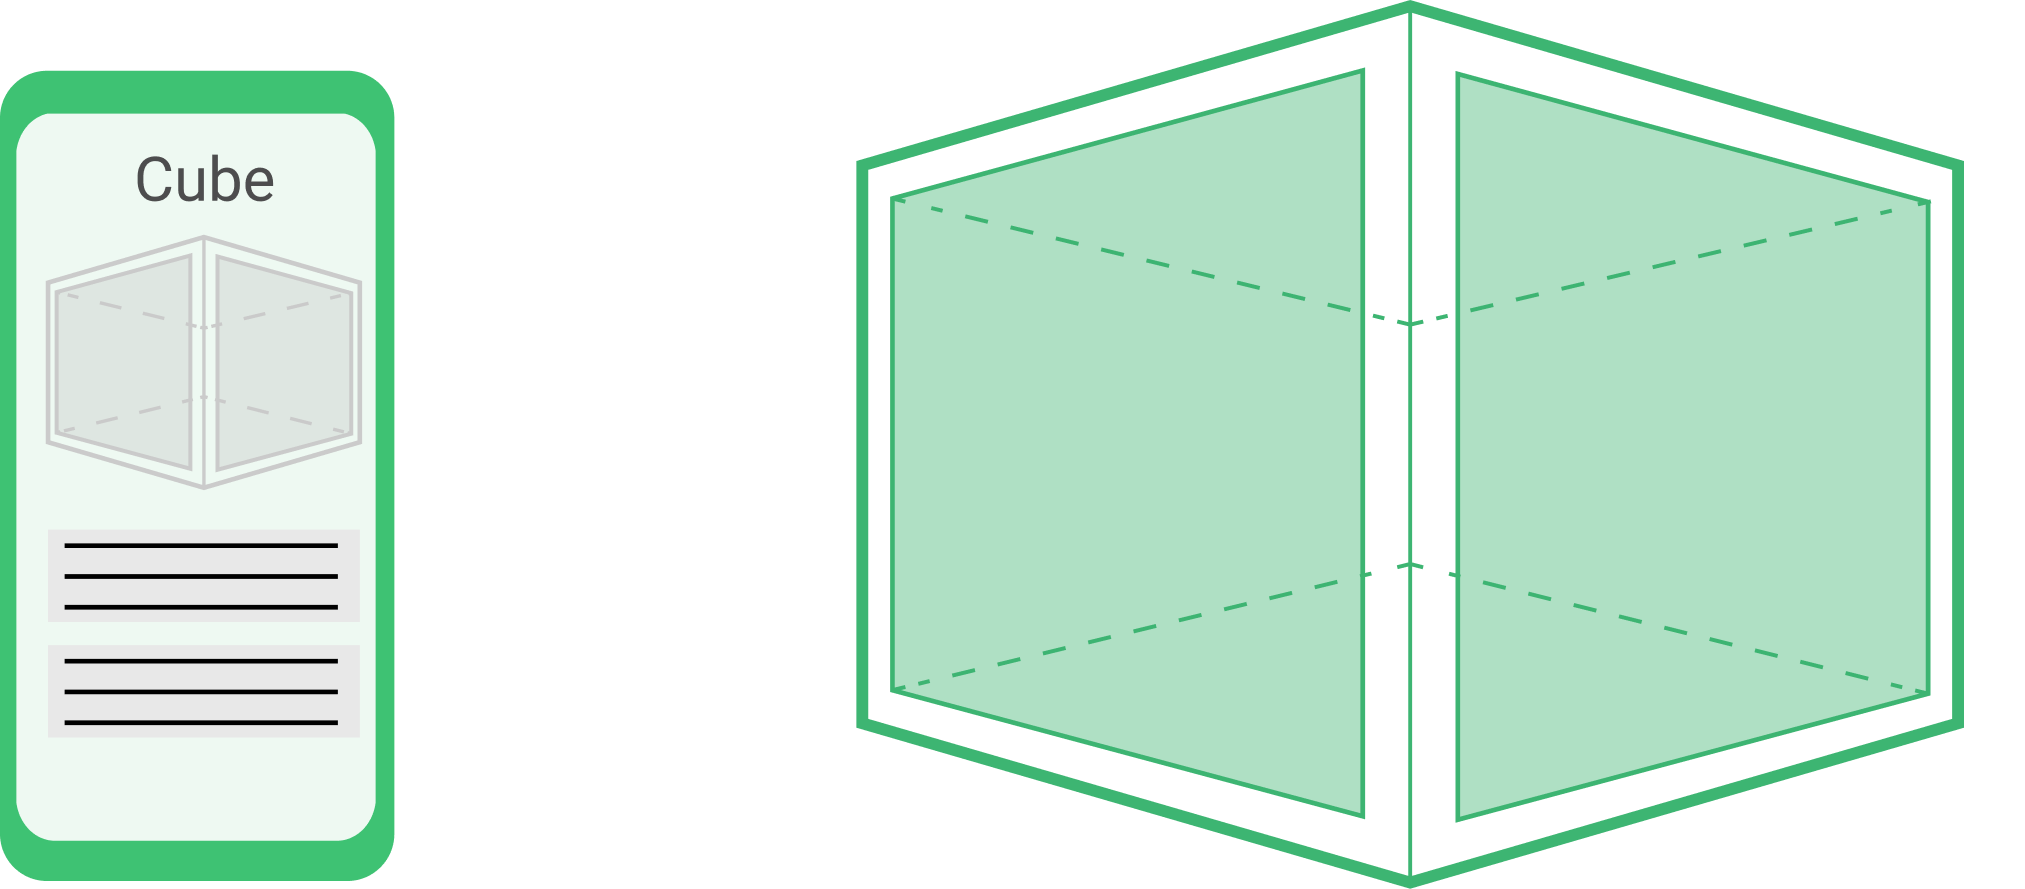
The Cube: A raw conceptual, modular physical space designed for effortless urban agriculture.
UFarm Mobile App: A central digital hub for crop management and a peer-to-peer exchange and marketplace.
Smart Logistics: A dual-track delivery system combining city-wide temperature-controlled lockers with autonomous drone transport.
Outcome:
A decentralized food network that reduces the carbon footprint of farm-to-table logistics. By 2030, UFarm empowers a conscious generation to reclaim health and food security, transforming cities into productive, green, and socially connected ecosystems.
BRIEF
In light of the revolutions introduced by the advent of the Information Age and the profound behavioral changes brought about by the New Normal or Next Normal, the workshop will focus on envisioning new experiences for the public space of our cities, 10 years from now.
RESEARCH INSIGHTS & ACTIONS

According to my research, some of the insights and possible actions are:
Utility
Insight: Urban Farming is beneficial for so many reasons like efficient use of land, growing communities and enhanced food security.
Action: Exploit spatial efficiency and social connectivity to establish a resilient urban food infrastructure.
Demographics
Insight: 800 Million are practicing Urban Farming with %54 having 4 year college degree.
Action: Leverage the high educated modern urban farmers to accelerate the adoption of new data-driven farming system.
Validation
Insight: %90 CEO believe that Sustainability is important for commercial success. The rise of organic market proves this.
Action: Bridge the rising demand for organic and commercial value of Sustainability.
The "New Normal" exposed a fragile reality: our cities are disconnected from their food sources and our communities are socially fragmented. While millions of urbanites are ready to grow food, others to ask for that fresh produce and live healthy. The challenge is not the concrete jungle, the space; it is a lack of Connection.
HMW unite urban growers and neighbors to harvest a healthier "New Normal" within the concrete jungle?
STRATEGY
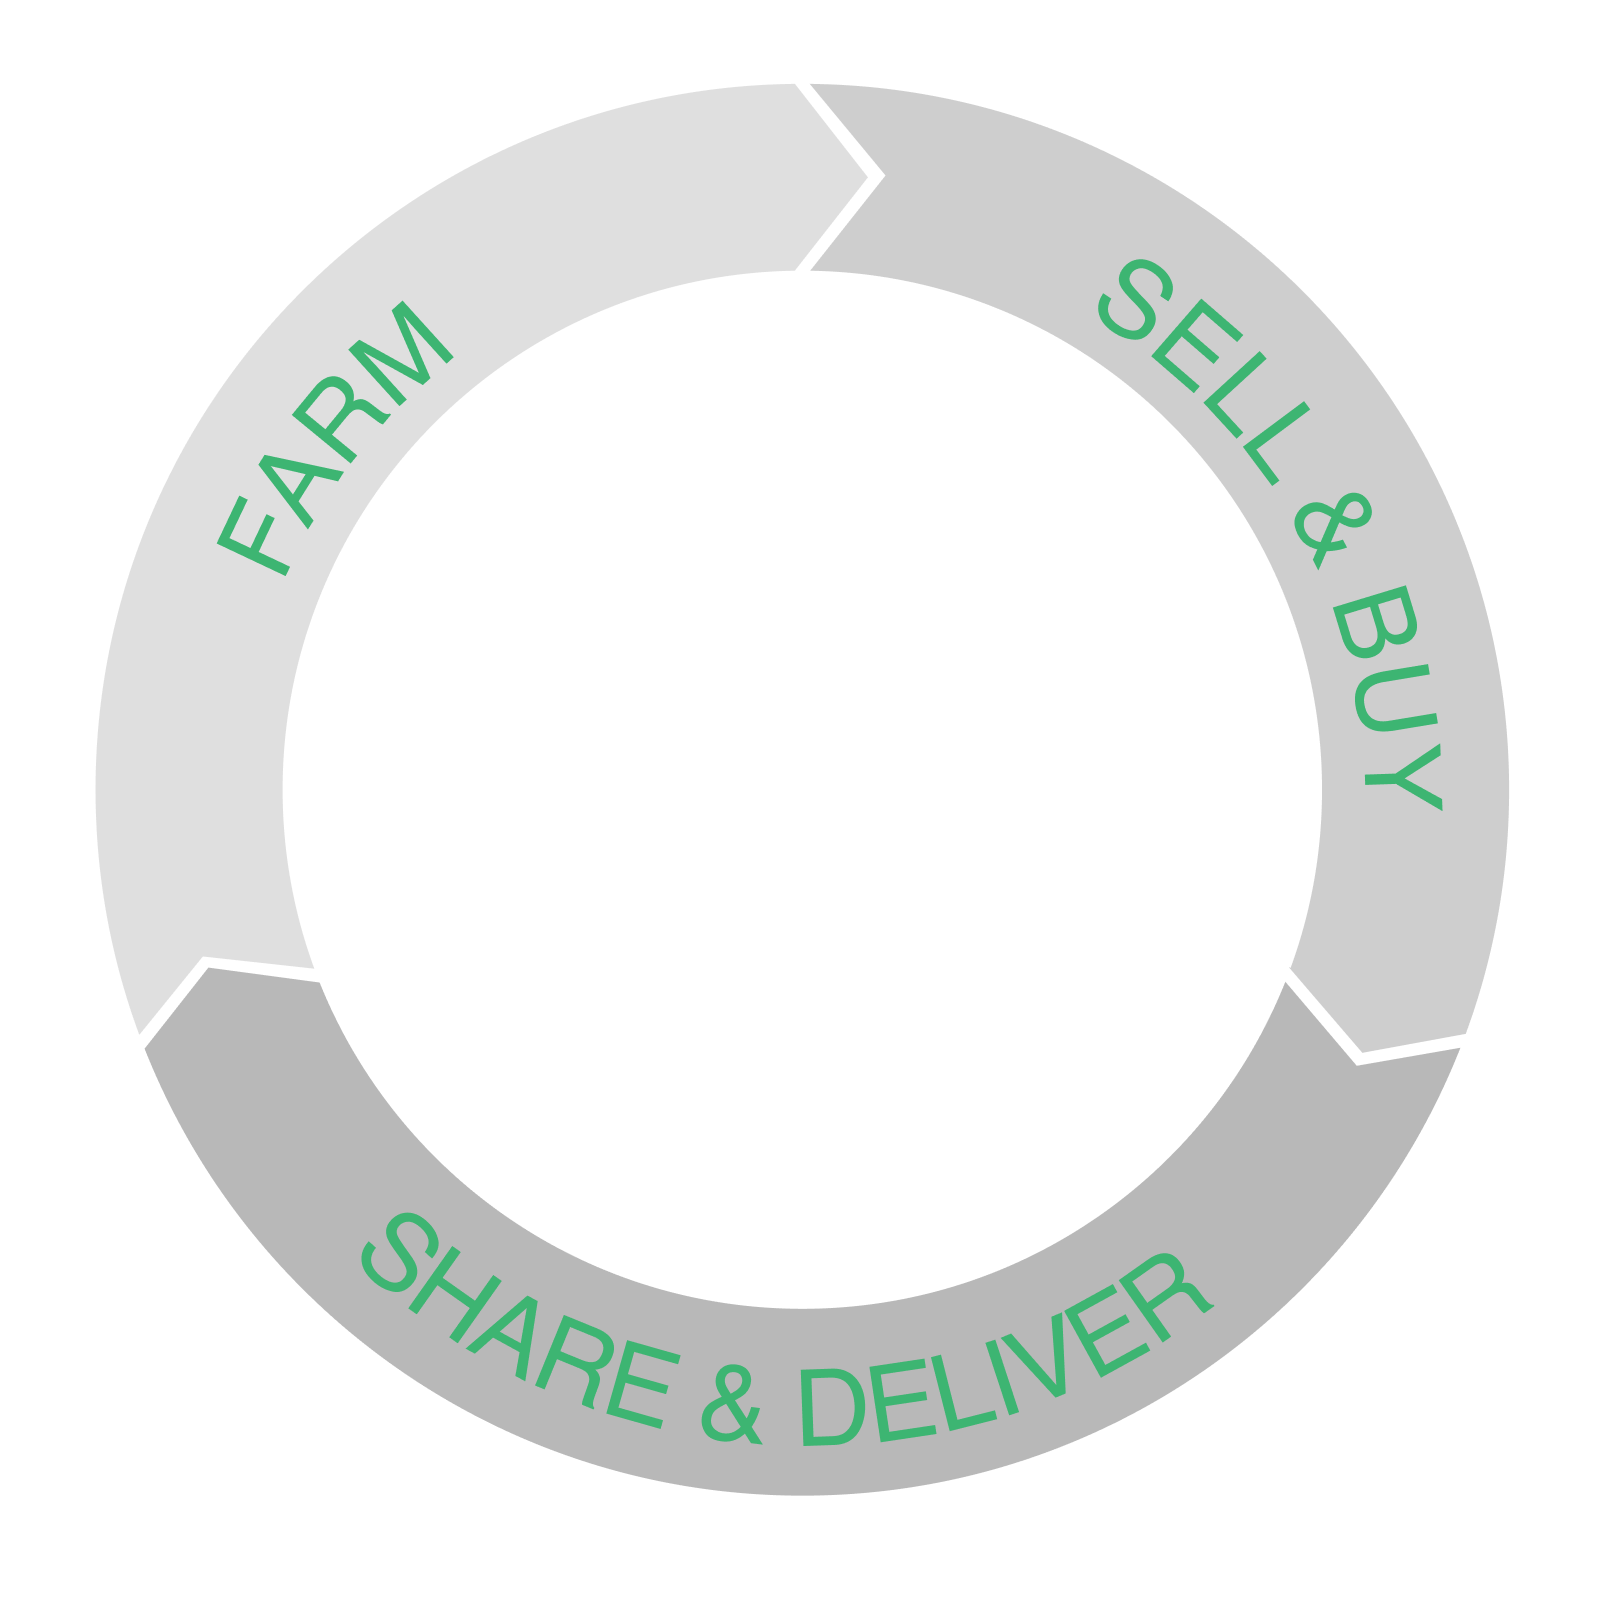
The connectivity of the community can be built by a holistic approach, by a system where the community can farm, sell & buy and share & deliver effortlessly.
MEET UFARM
Following a solid Design process, UFarm came to life.
U.Farm is an Urban Farming and sharing system idea. It aims to bring both types of the the users who want to farm in a city and who want to consume fresh, organic food and so to become a healthy, environmentalist platform.
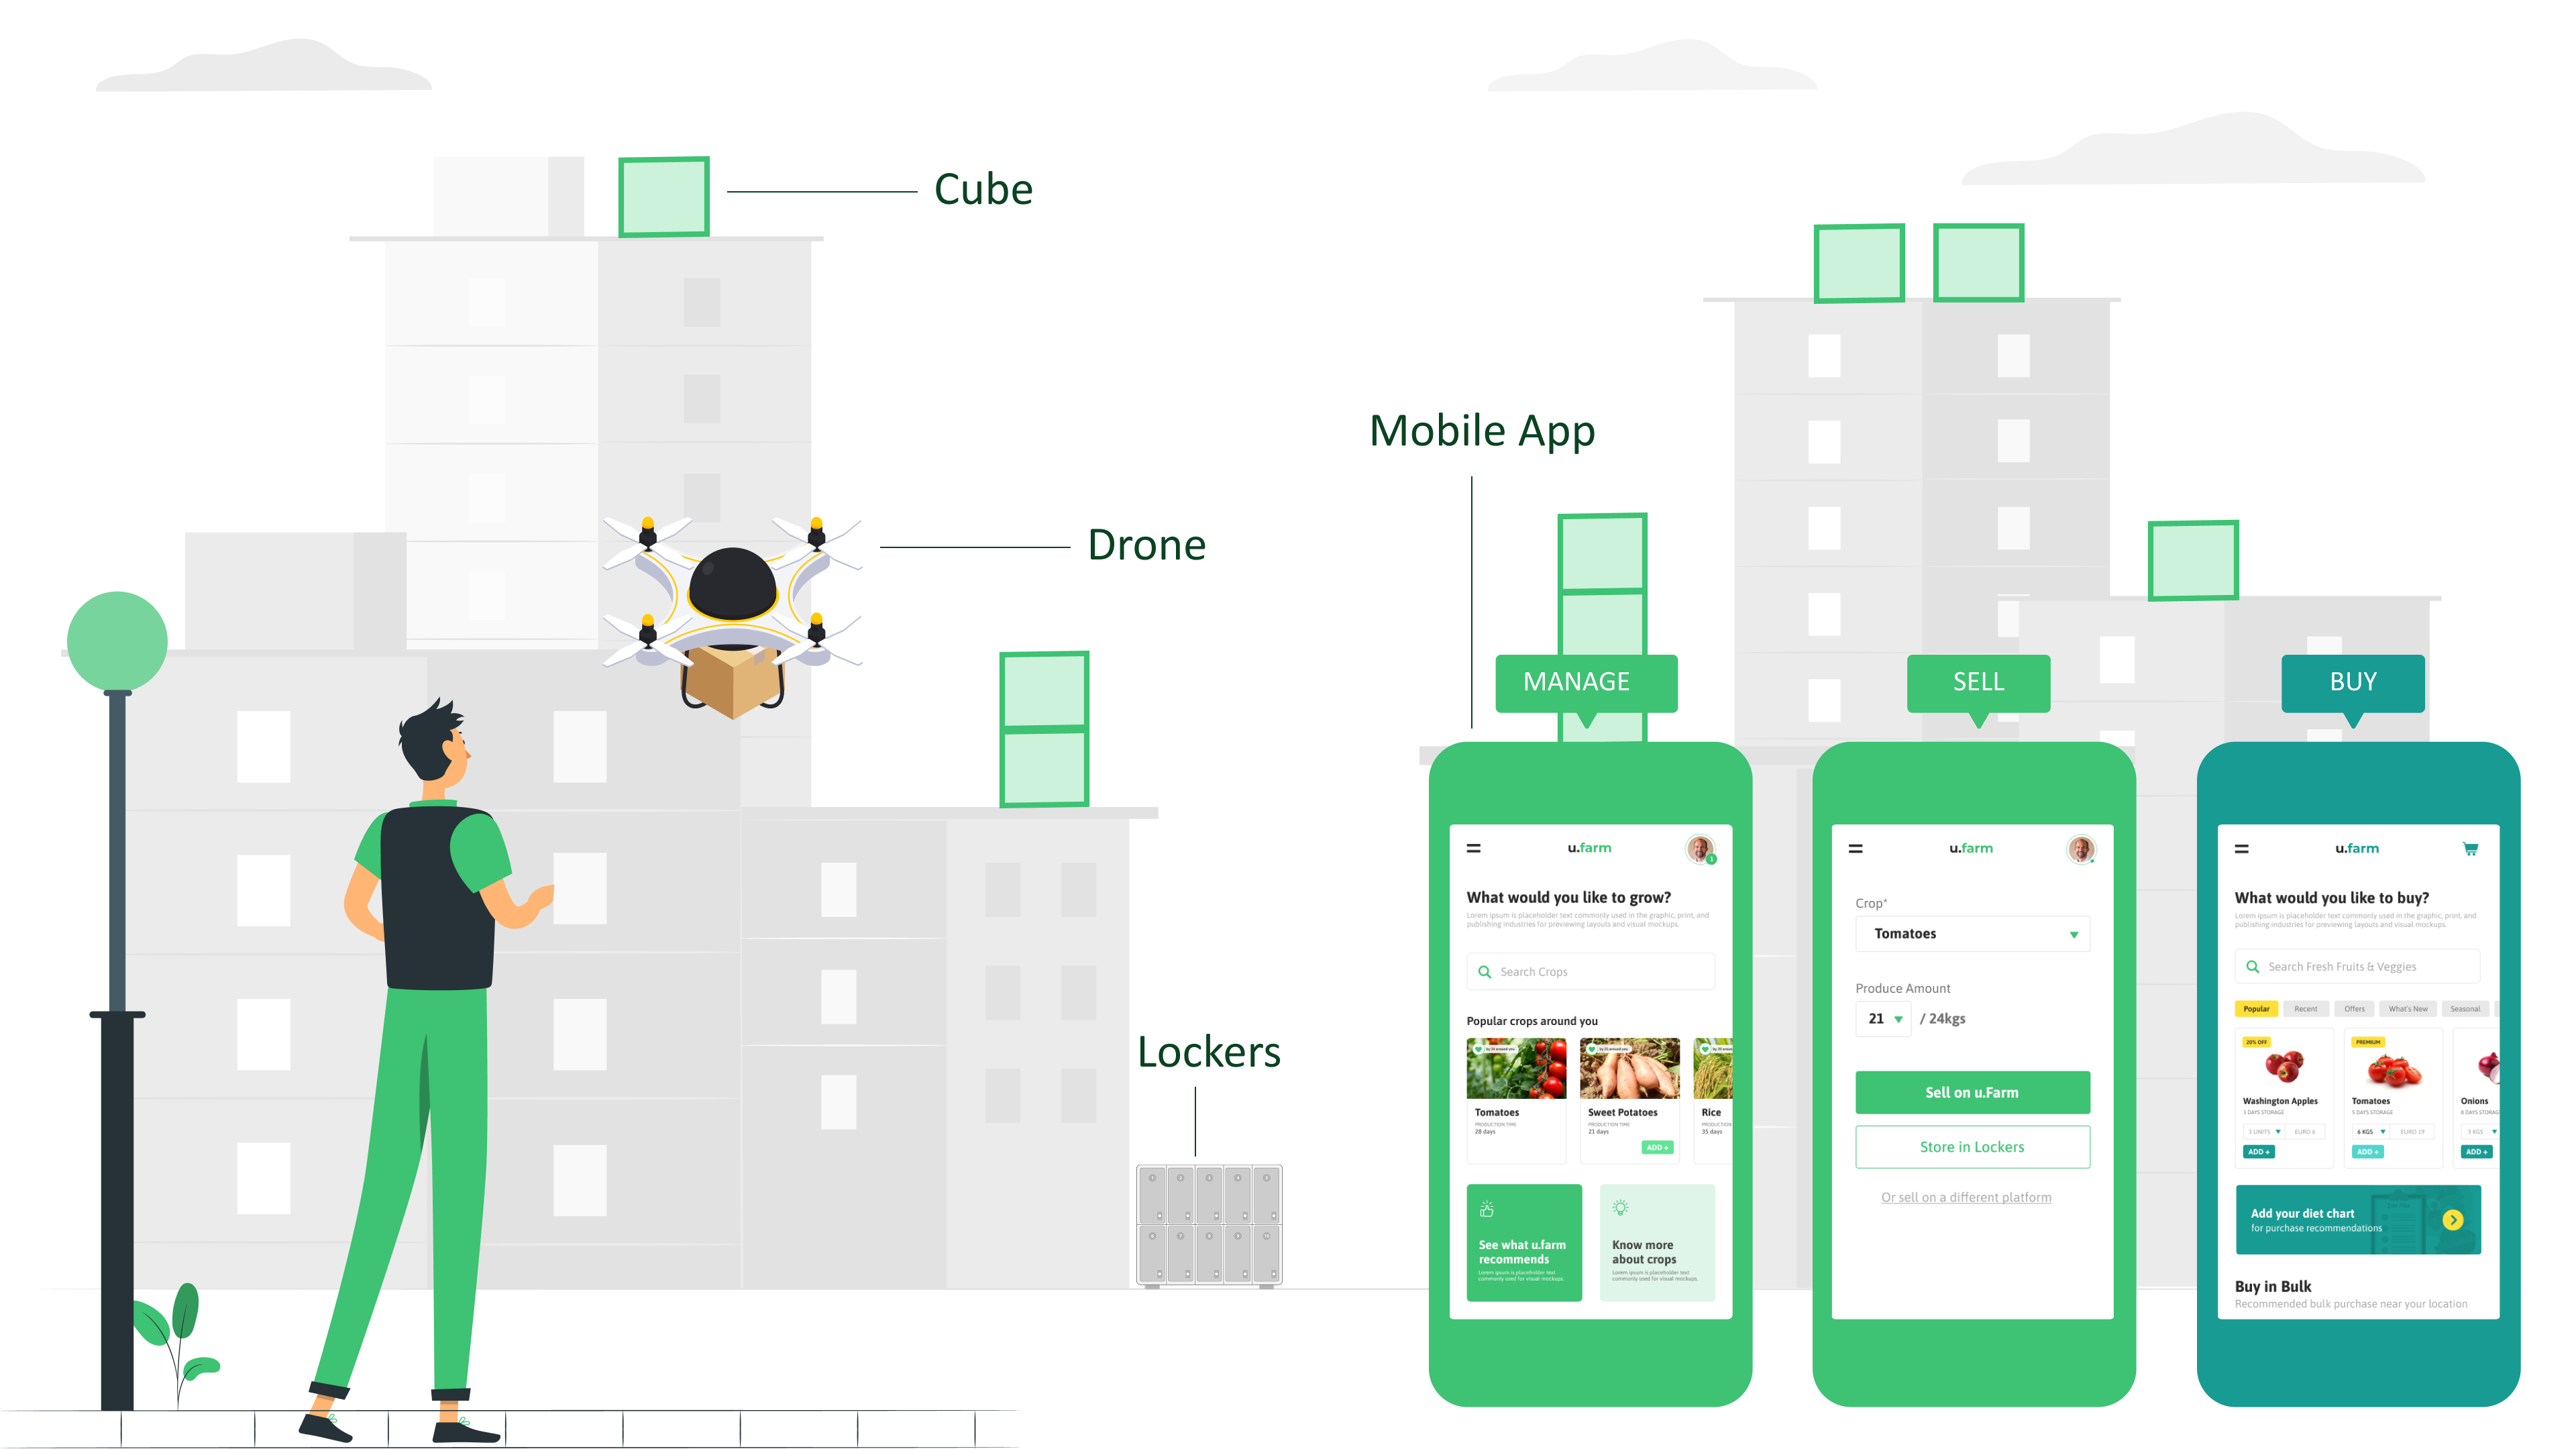
MOBILE APP
Mobile App is the center of U.Farm system.
KEY FEATURES
Cube
1 - Saving Crops
The user owning Cube starts growing by saving crops of their will.
2 - Adding to Cube
Saved crops then need to be added to Cube for organized management.
3 - Starting Crops
User starts the crops so Cube schedules the best care plan for the selected crops and their specific needs.
Crops
1 - Details
All the information of a selected produce is listed.
2 - Place on Marketplace
User easily places their crops on marketplace to sell.
Dashboard
1 - Essentials
Dashboard is intended to convey all the essential information at once without the need to navigate so much.
2 - Switch Profile
Every user has 2 profiles: Cuber and Buyer. Floating button on dashboard switches the profiles easily.
DESIGN PROCESS
To reach to ideal SOLUTION, I followed a set of processes like low-fi exploration, User Journey, Prototyping etc.
PERSONA
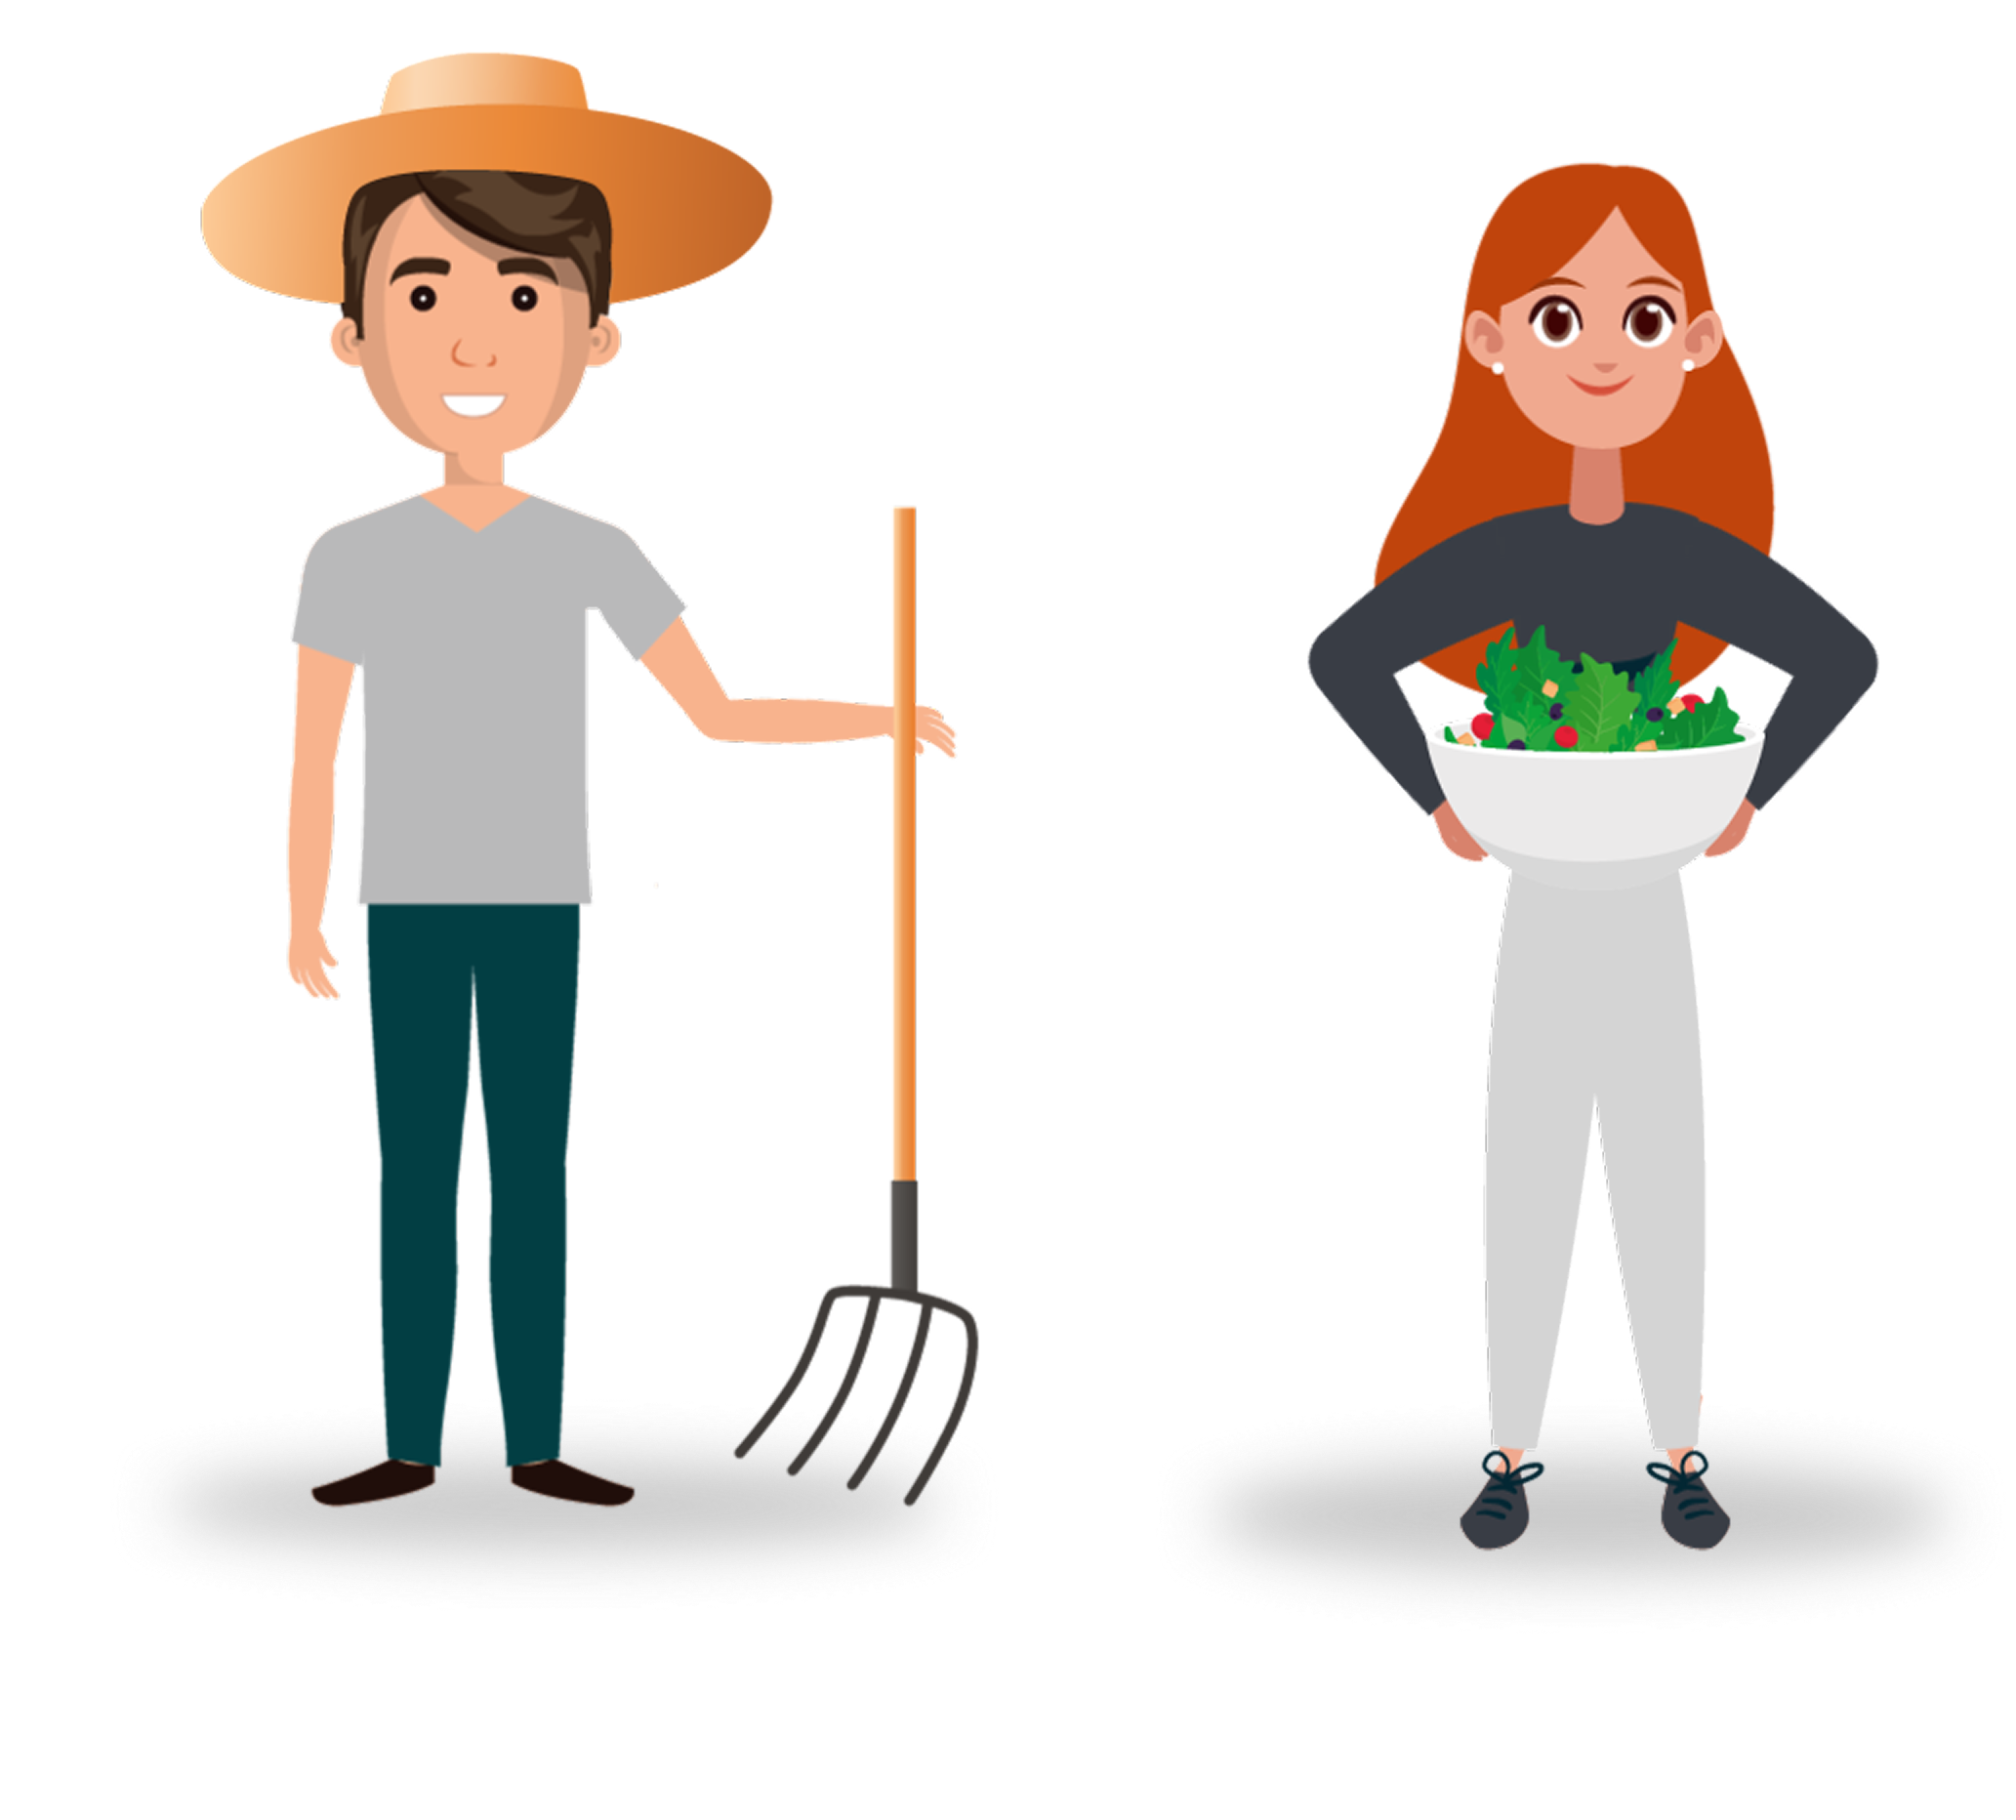
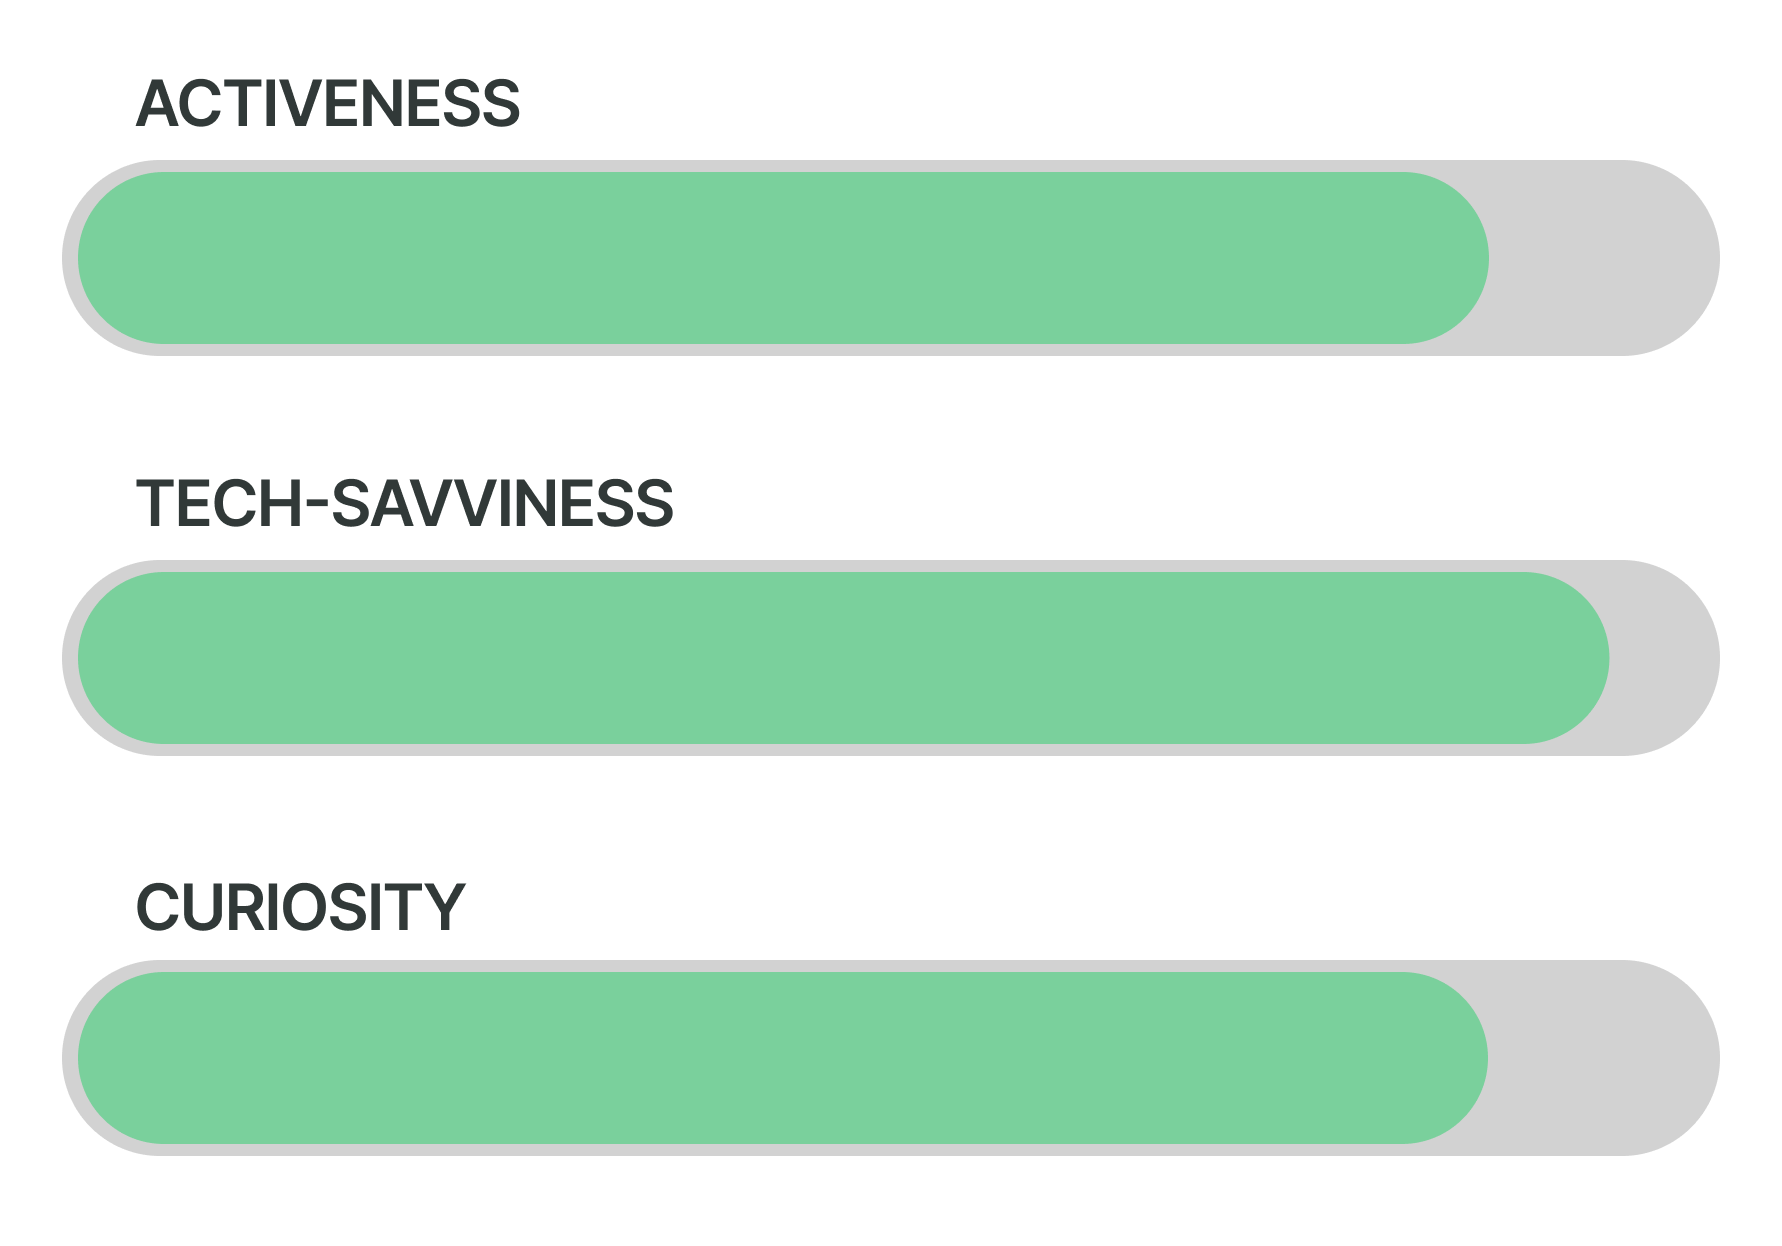
Giovanni
“I am stuck in the city among the concrete jungle.
I want to feel the nature, to grow my own food and to be fed healthy”
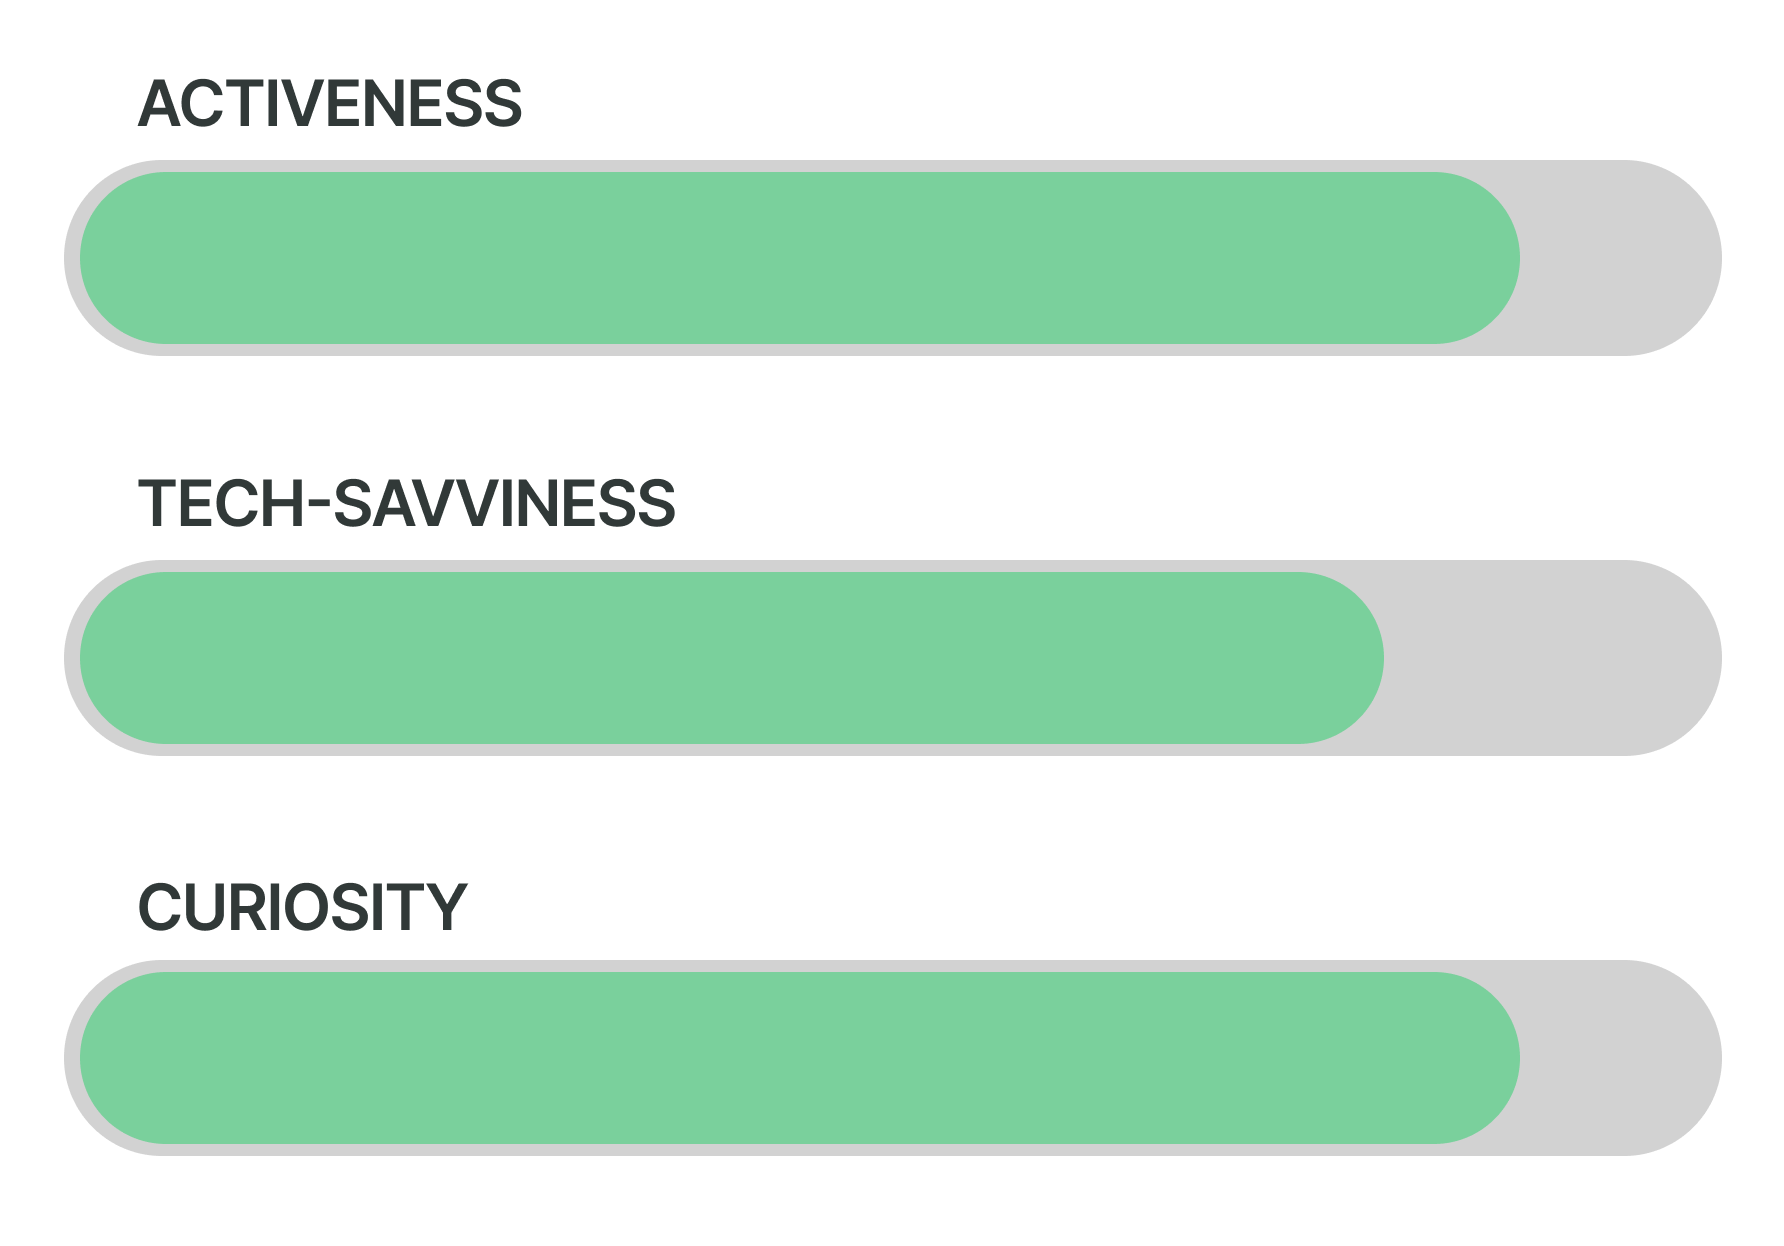
Giulia
“I am doing Yoga & Meditation, running everyday, but I am not sure what I am eating. I want to eat fresh, organic food, want to be healthy”
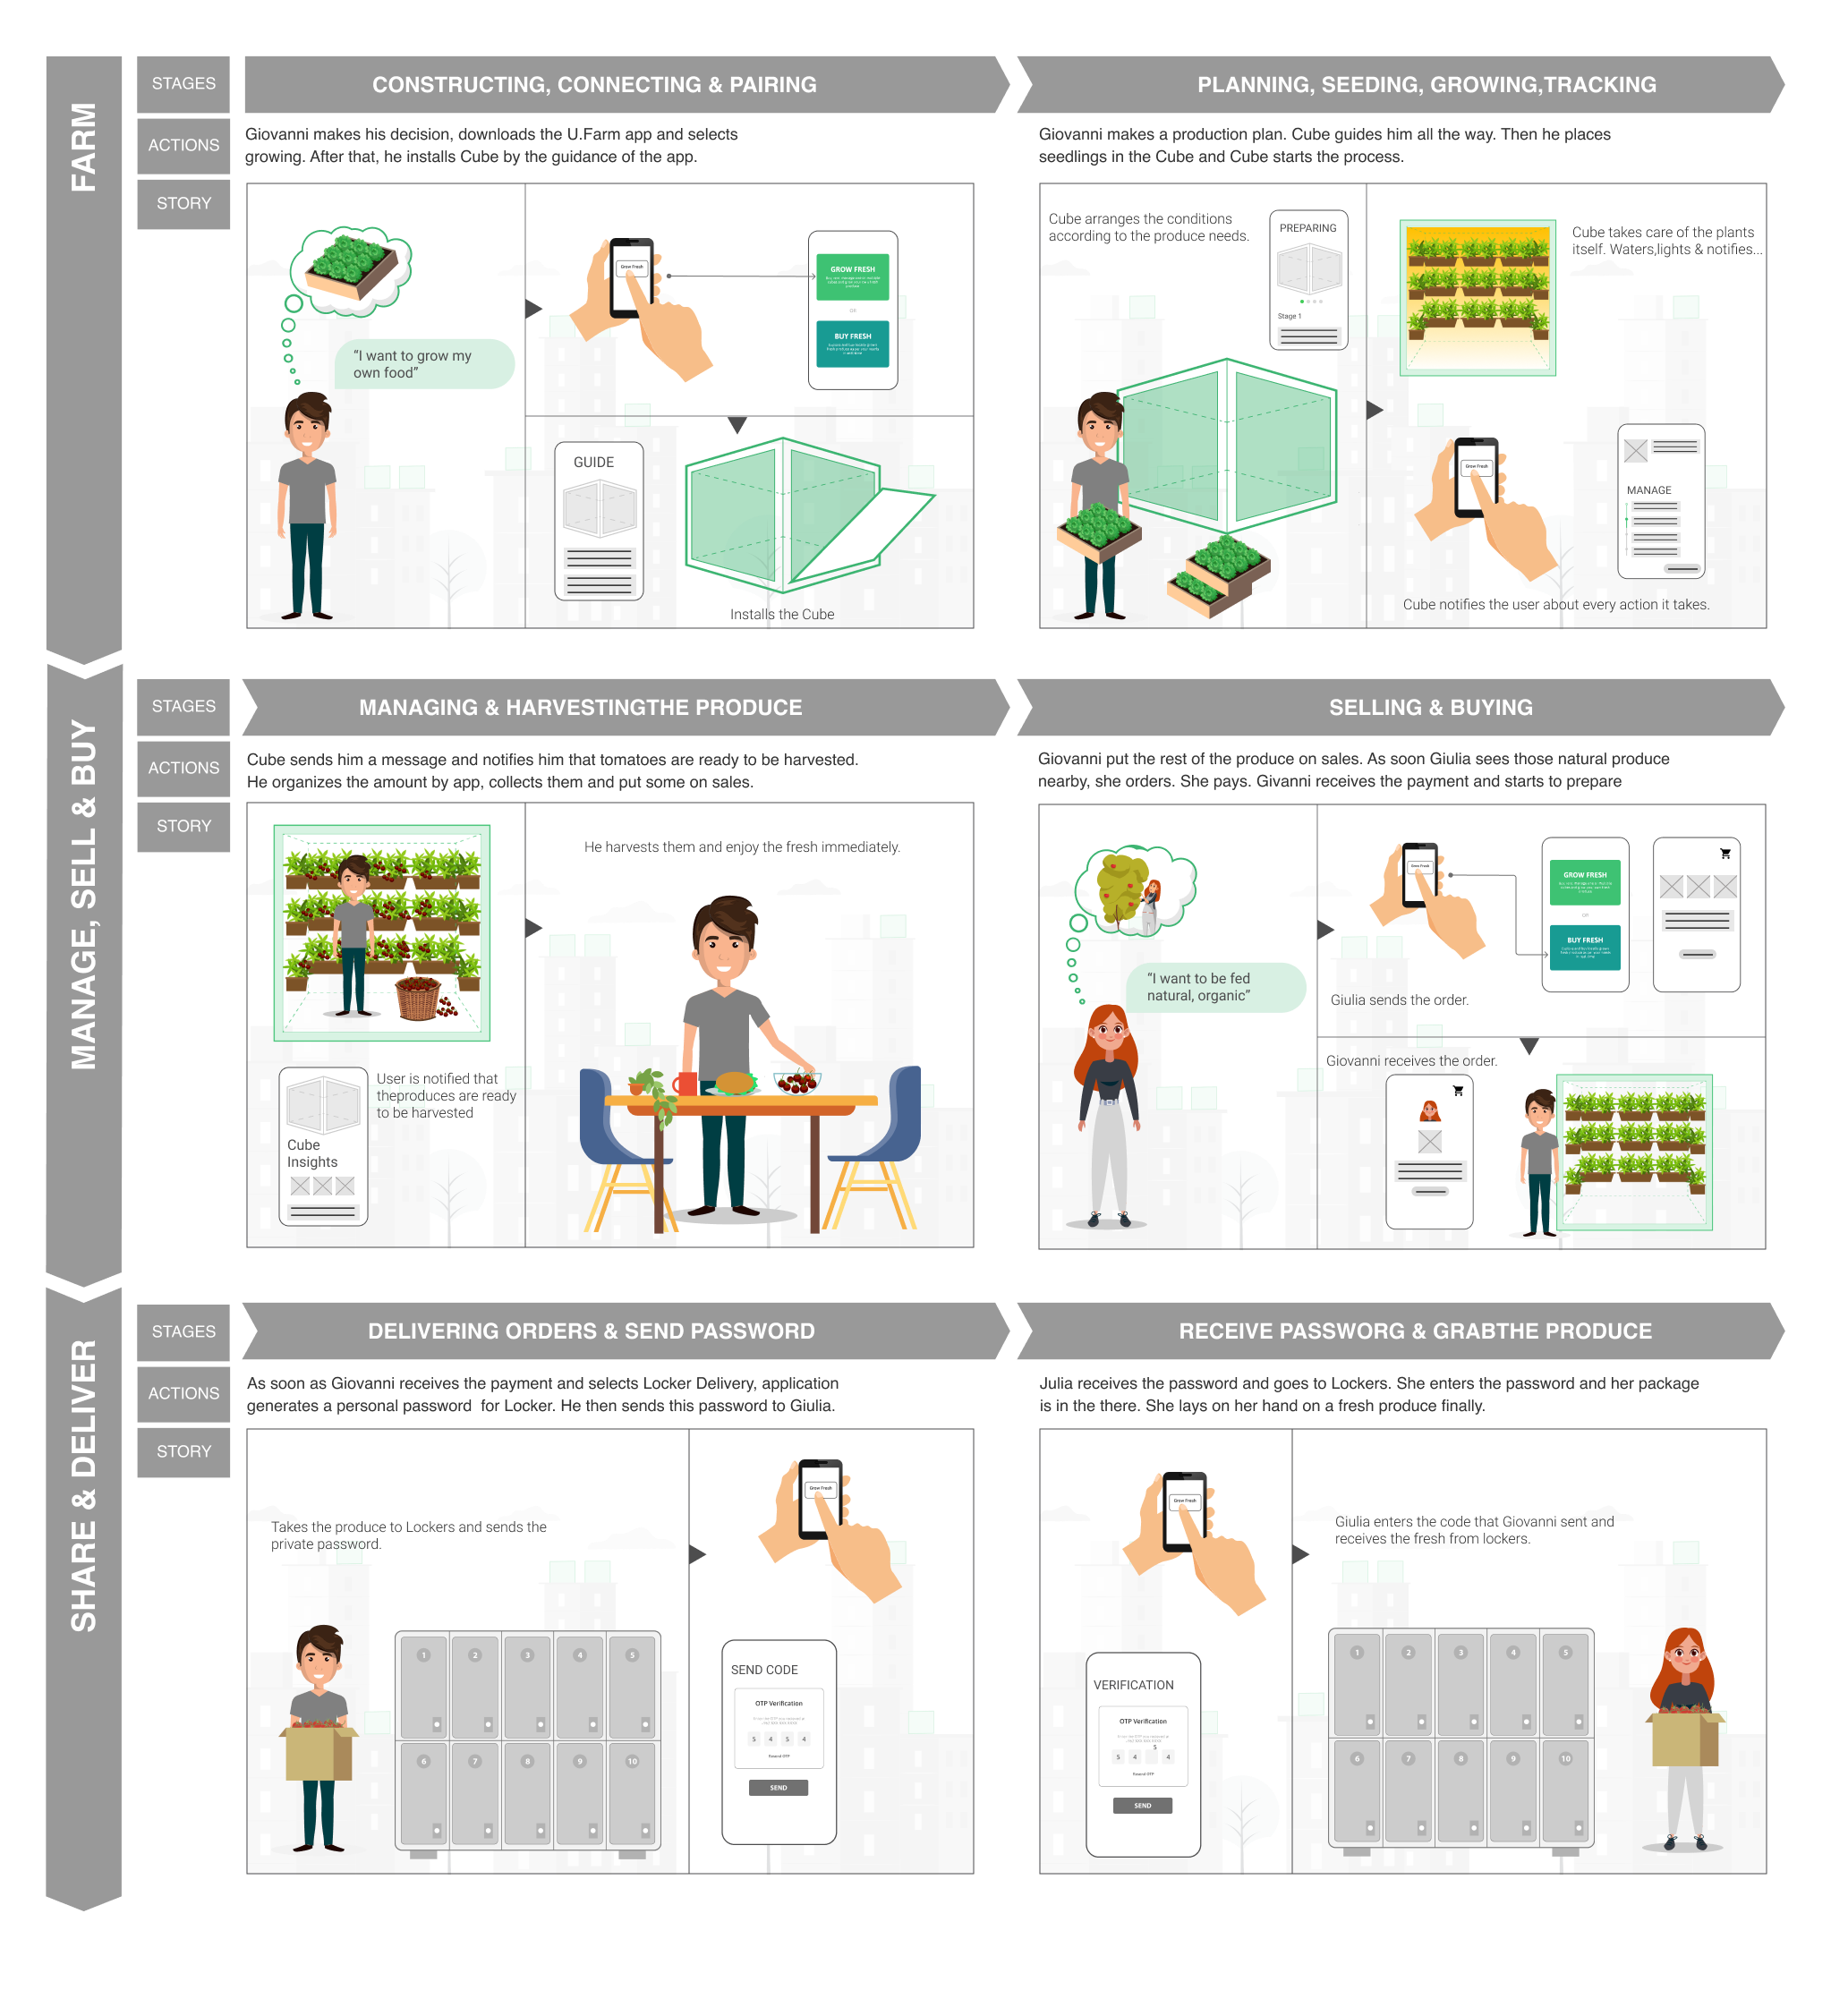
USER JOURNEY
In accordance with User Insights, I expect to have a User Journey like this.
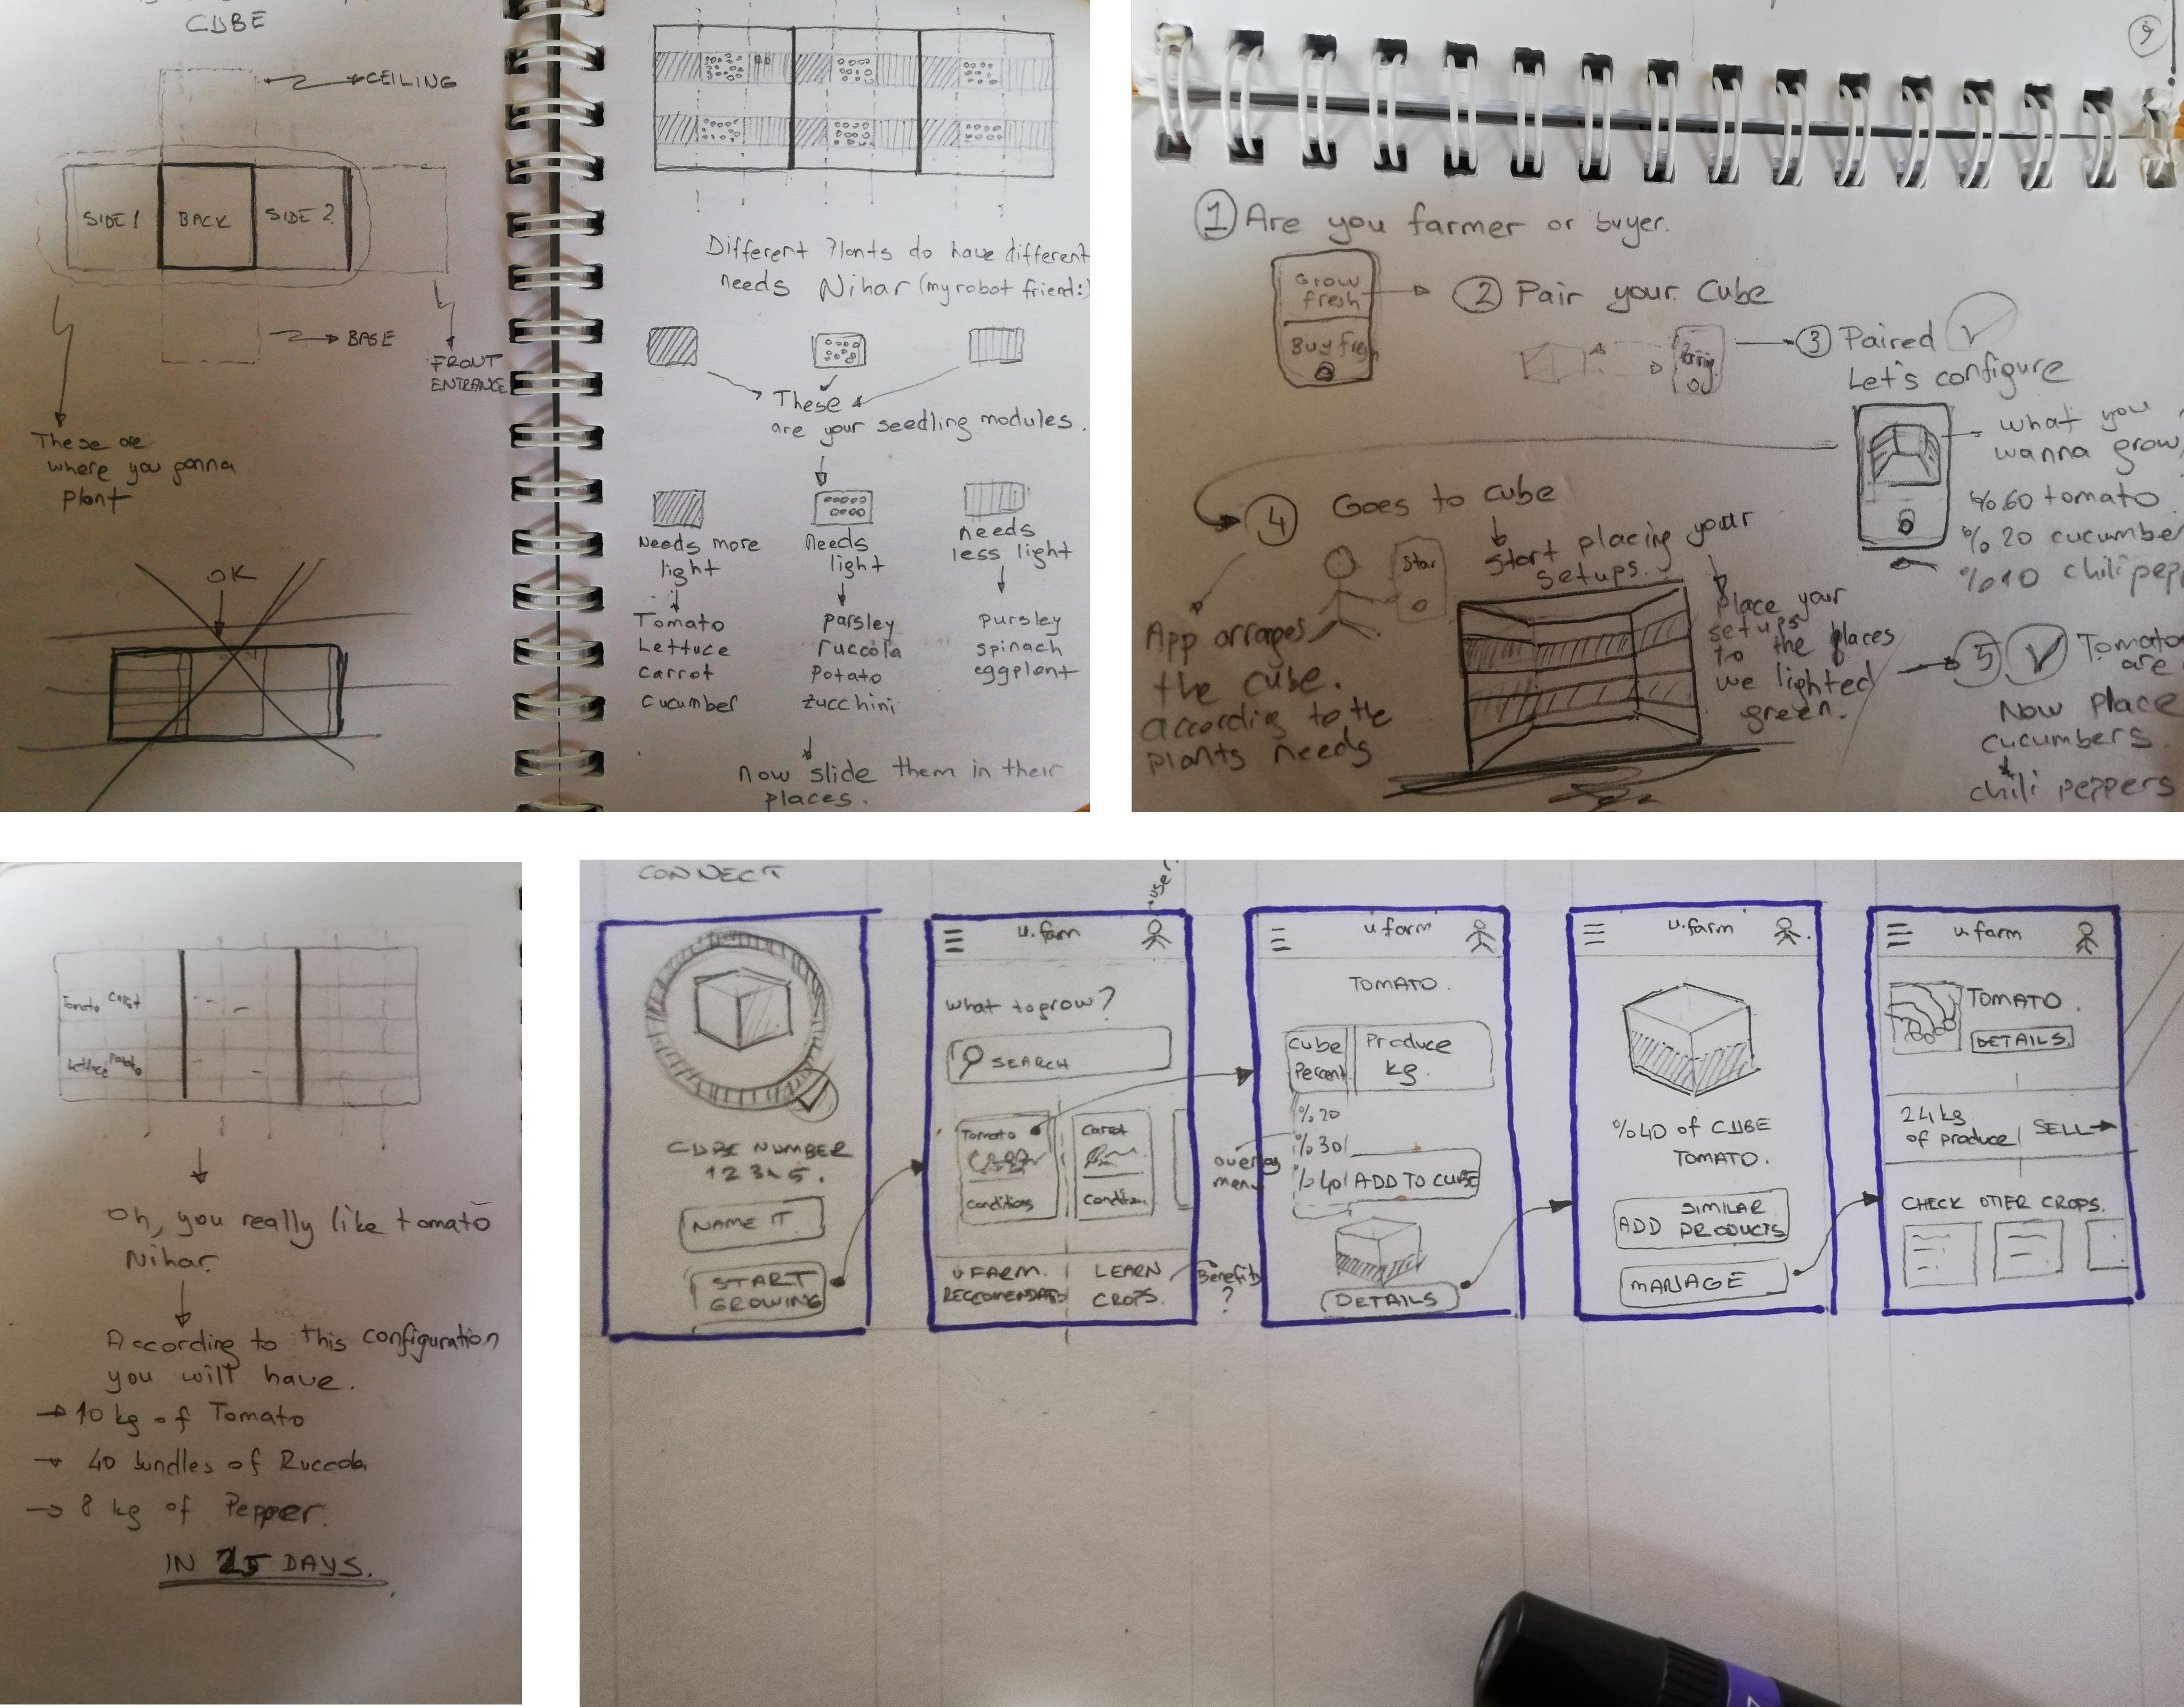
EXPLORATION
TOUCH POINTS
Let’s connect


Aycal Cagri Ozen
Works
U.Farm
About
UFARM
Nature at Your Doorstep
It was Covid times, the times called New Normal as a virus shook the whole world and pushed the humanity to rethink about their behaviors, lives, cities. By this influence, I designed UFarm, which is a combination of digital and physical experience projected in 2030, for people genuinely interested in farming and in eating healthy in cities.
THE SNAPSHOT
The Challenge:
Urbanization and post-COVID lifestyles have weakened people’s connection to fresh food. As cities will host 70% of the population by 2050, future urban landscapes must prioritize wellbeing, clean air, and local food production.
The Solution:
UFarm reimagines urban agriculture for 2030 through a hybrid ecosystem of modular farming units and a community platform, empowering Gen Z and Millennials to shift from consumers to urban food producers.
Key Deliverables:
The Cube: A raw conceptual, modular physical space designed for effortless urban agriculture.
UFarm Mobile App: A central digital hub for crop management and a peer-to-peer exchange and marketplace.
Smart Logistics: A dual-track delivery system combining city-wide temperature-controlled lockers with autonomous drone transport.
Outcome:
A decentralized food network that reduces the carbon footprint of farm-to-table logistics. By 2030, UFarm empowers a conscious generation to reclaim health and food security, transforming cities into productive, green, and socially connected ecosystems.
BRIEF
In light of the revolutions introduced by the advent of the Information Age and the profound behavioral changes brought about by the New Normal or Next Normal, the workshop will focus on envisioning new experiences for the public space of our cities, 10 years from now.
RESEARCH INSIGHTS & ACTIONS
According to my research, some of the insights and possible actions are:
Utility
Insight: Urban Farming is beneficial for so many reasons like efficient use of land, growing communities and enhanced food security.
Action: Exploit spatial efficiency and social connectivity to establish a resilient urban food infrastructure.
Demographics
Insight: 800 Million are practicing Urban Farming with %54 having 4 year college degree.
Action: Leverage the high educated modern urban farmers to accelerate the adoption of new data-driven farming system.
Validation
Insight: %90 CEO believe that Sustainability is important for commercial success. The rise of organic market proves this.
Action: Bridge the rising demand for organic and commercial value of Sustainability.
The "New Normal" exposed a fragile reality: our cities are disconnected from their food sources and our communities are socially fragmented. While millions of urbanites are ready to grow food, others to ask for that fresh produce and live healthy. The challenge is not the concrete jungle, the space; it is a lack of Connection.
HMW unite urban growers and neighbors to harvest a healthier "New Normal" within the concrete jungle?
STRATEGY
The connectivity of the community can be built by a holistic approach, by a system where the community can farm, sell & buy and share & deliver effortlessly.
MEET UFARM
Following a solid Design process, UFarm came to life.
U.Farm is an Urban Farming and sharing system idea. It aims to bring both types of the the users who want to farm in a city and who want to consume fresh, organic food and so to become a healthy, environmentalist platform.
MOBILE APP
Mobile App is the center of U.Farm system.
KEY FEATURES
Cube
1 - Saving Crops
The user owning Cube starts growing by saving crops of their will.
2 - Adding to Cube
Saved crops then need to be added to Cube for organized management.
3 - Starting Crops
User starts the crops so Cube schedules the best care plan for the selected crops and their specific needs.
Crops
1 - Details
All the information of a selected produce is listed.
2 - Place on Marketplace
User easily places their crops on marketplace to sell.
Dashboard
1 - Essentials
Dashboard is intended to convey all the essential information at once without the need to navigate so much.
2 - Switch Profile
Every user has 2 profiles: Cuber and Buyer. Floating button on dashboard switches the profiles easily.
DESIGN PROCESS
To reach to ideal SOLUTION, I followed a set of processes like low-fi exploration, User Journey, Prototyping etc.
PERSONA
Giovanni
“I am stuck in the city among the concrete jungle.
I want to feel the nature, to grow my own food and to be fed healthy”
Giulia
“I am doing Yoga & Meditation, running everyday, but I am not sure what I am eating. I want to eat fresh, organic food, want to be healthy”
USER JOURNEY
In accordance with User Insights, I expect to have a User Journey like this.
EXPLORATION
TOUCH POINTS
Aycal Cagri Ozen
Let’s connect
Works
U.Farm
About
UFARM
Nature at Your Doorstep
It was Covid times, the times called New Normal as a virus shook the whole world and pushed the humanity to rethink about their behaviors, lives, cities. By this influence, I designed UFarm, which is a combination of digital and physical experience projected in 2030, for people genuinely interested in farming and in eating healthy in cities.
THE SNAPSHOT
The Challenge:
Urbanization and post-COVID lifestyles have weakened people’s connection to fresh food. As cities will host 70% of the population by 2050, future urban landscapes must prioritize wellbeing, clean air, and local food production.
The Solution:
UFarm reimagines urban agriculture for 2030 through a hybrid ecosystem of modular farming units and a community platform, empowering Gen Z and Millennials to shift from consumers to urban food producers.
Key Deliverables:
The Cube: A raw conceptual, modular physical space designed for effortless urban agriculture.
UFarm Mobile App: A central digital hub for crop management and a peer-to-peer exchange and marketplace.
Smart Logistics: A dual-track delivery system combining city-wide temperature-controlled lockers with autonomous drone transport.
Outcome:
A decentralized food network that reduces the carbon footprint of farm-to-table logistics. By 2030, UFarm empowers a conscious generation to reclaim health and food security, transforming cities into productive, green, and socially connected ecosystems.
BRIEF
In light of the revolutions introduced by the advent of the Information Age and the profound behavioral changes brought about by the New Normal or Next Normal, the workshop will focus on envisioning new experiences for the public space of our cities, 10 years from now.
RESEARCH INSIGHTS & ACTIONS
According to my research, some of the insights and possible actions are:
Utility
Insight: Urban Farming is beneficial for so many reasons like efficient use of land, growing communities and enhanced food security.
Action: Exploit spatial efficiency and social connectivity to establish a resilient urban food infrastructure.
Demographics
Insight: 800 Million are practicing Urban Farming with %54 having 4 year college degree.
Action: Leverage the high educated modern urban farmers to accelerate the adoption of new data-driven farming system.
Validation
Insight: %90 CEO believe that Sustainability is important for commercial success. The rise of organic market proves this.
Action: Bridge the rising demand for organic and commercial value of Sustainability.
The "New Normal" exposed a fragile reality: our cities are disconnected from their food sources and our communities are socially fragmented. While millions of urbanites are ready to grow food, others to ask for that fresh produce and live healthy. The challenge is not the concrete jungle, the space; it is a lack of Connection.
HMW unite urban growers and neighbors to harvest a healthier "New Normal" within the concrete jungle?
STRATEGY
The connectivity of the community can be built by a holistic approach, by a system where the community can farm, sell & buy and share & deliver effortlessly.
MEET UFARM
MOBILE APP
Mobile App is the center of U.Farm system.
KEY FEATURES
Cube
1 - Saving Crops
The user owning Cube starts growing by saving crops of their will.
2 - Adding to Cube
Saved crops then need to be added to Cube for organized management.
3 - Starting Crops
User starts the crops so Cube schedules the best care plan for the selected crops and their specific needs.
Crops
1 - Details
All the information of a selected produce is listed.
2 - Place on Marketplace
User easily places their crops on marketplace to sell.
Dashboard
1 - Essentials
Dashboard is intended to convey all the essential information at once without the need to navigate so much.
2 - Switch Profile
Every user has 2 profiles: Cuber and Buyer. Floating button on dashboard switches the profiles easily.
DESIGN PROCESS
PERSONA
Giovanni
“I am stuck in the city among the concrete jungle.
I want to feel the nature, to grow my own food and to be fed healthy”
Giulia
“I am doing Yoga & Meditation, running everyday, but I am not sure what I am eating. I want to eat fresh, organic food, want to be healthy”
USER JOURNEY
In accordance with User Insights, I expect to have a User Journey like this.
TOUCH POINTS
EXPLORATION
Aycal Cagri Ozen
Let’s connect